Training Visualization
Function
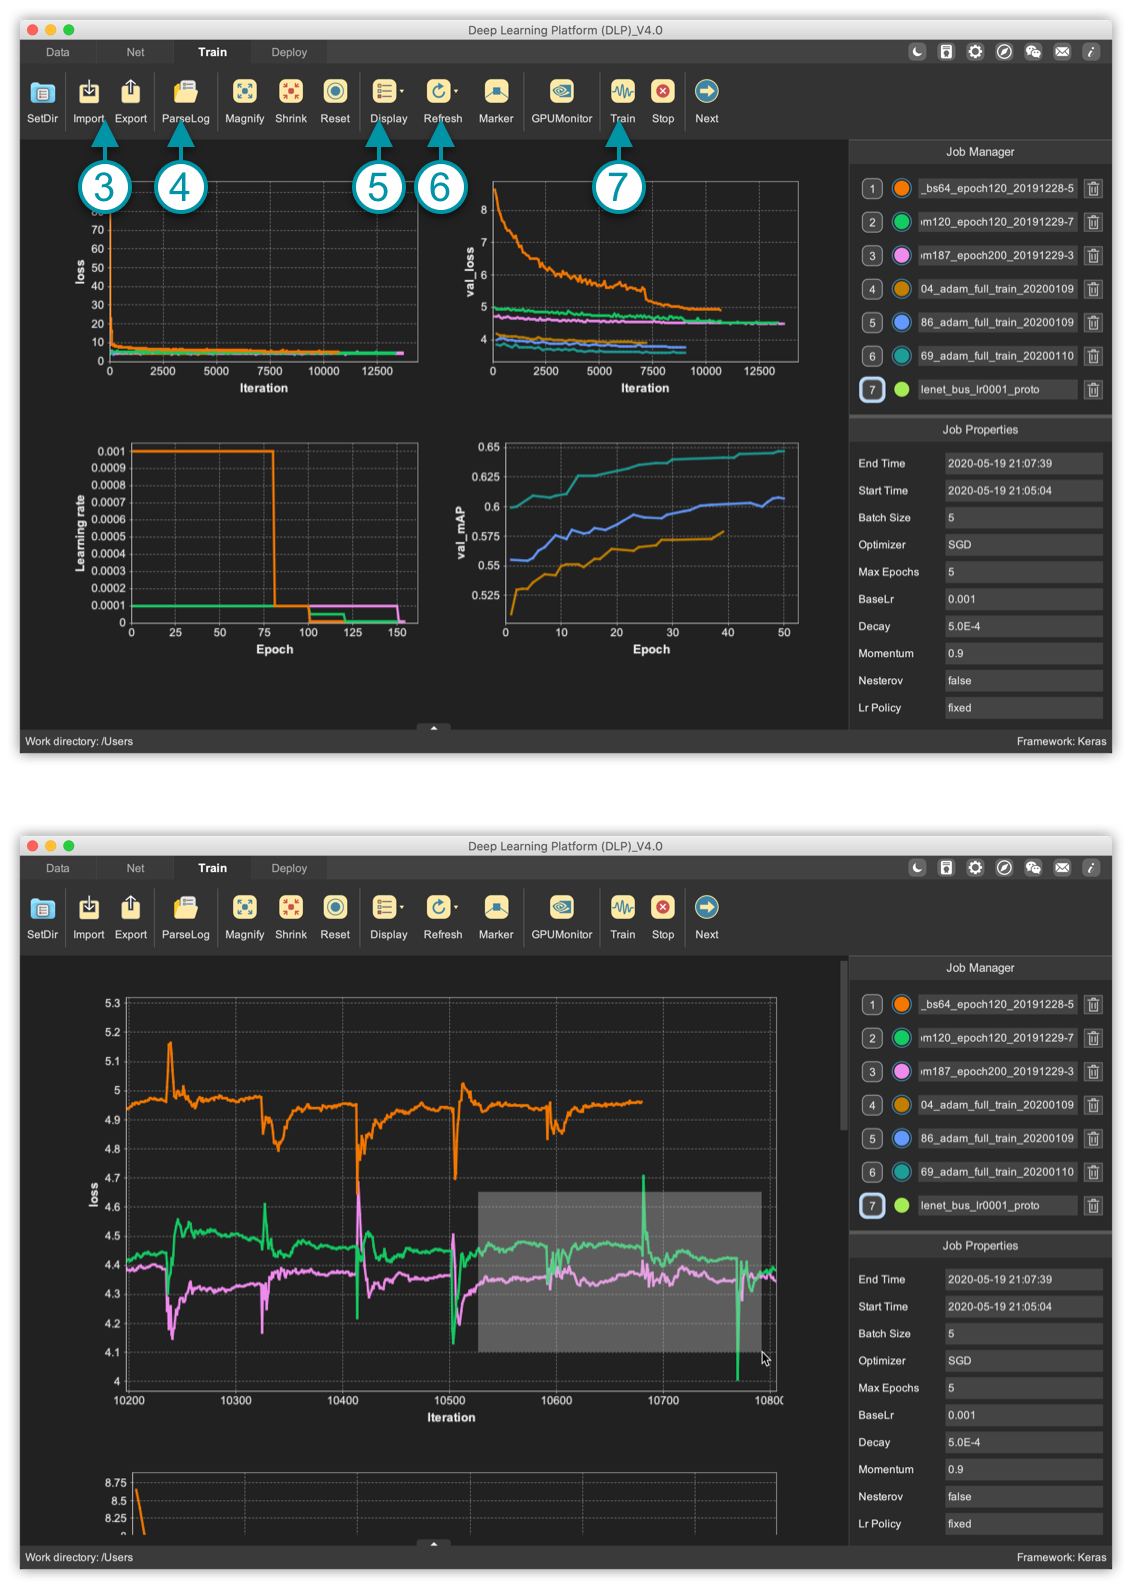
(1) Plotting: each job is assigned a color. The plotting with the same Y-axis title will be put in the same figure. By clicking the circular button, you can choose whether to plot the curve or not.
(2) Job Properties: click the yellow job ID button, solver parameters of the selected job will be displayed in the property panel.
(3) Import & Export: all information in the training module can be exported to one single file. You can retrieve all training information by importing the exported file.
(4) Parse log: load a training log file (Caffe/Keras), DLP will parse the file, extract training information and plot the curves.
(5) Display: support two x-axis items: iteration and time.
(6) Refresh: you can define the plotting refreshing interval: 1 second, 5 seconds & 15 seconds.
(7) Train: you can load a Keras code file generated by DLP in “Net” module, and train the model in DLP Docker container.
(8) Focus: select an area over plotting to plot the curve within selected area.